Current Career Outcomes for Basic Biomedical Science PhD Graduates
Last updated October 2025
Current Career Outcomes by Years
Scroll down to see outcomes broken out into shorter ranges of years.

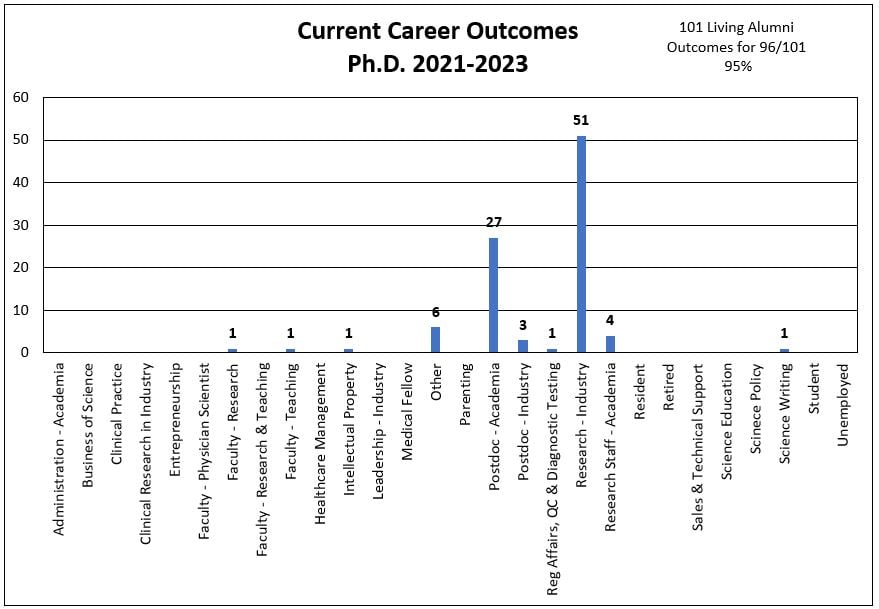
2021-2023
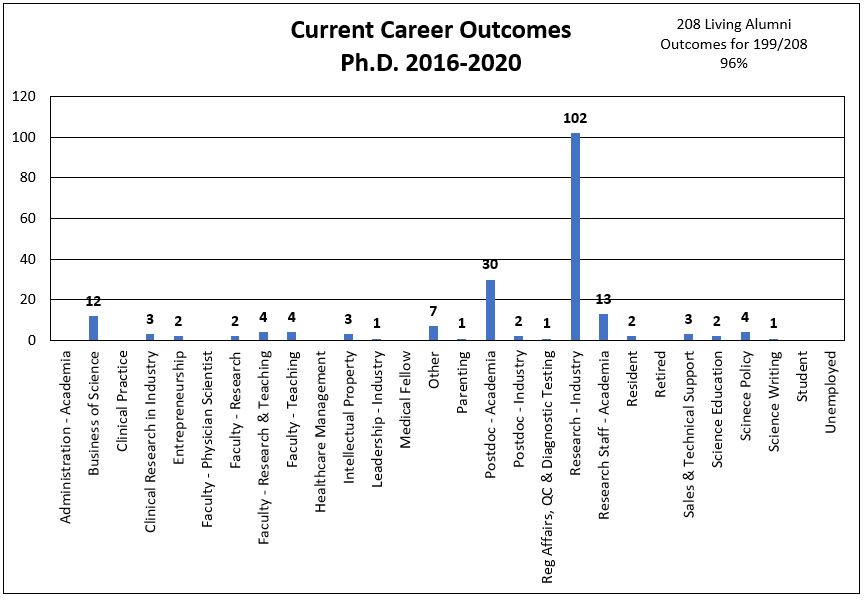
2016-2020
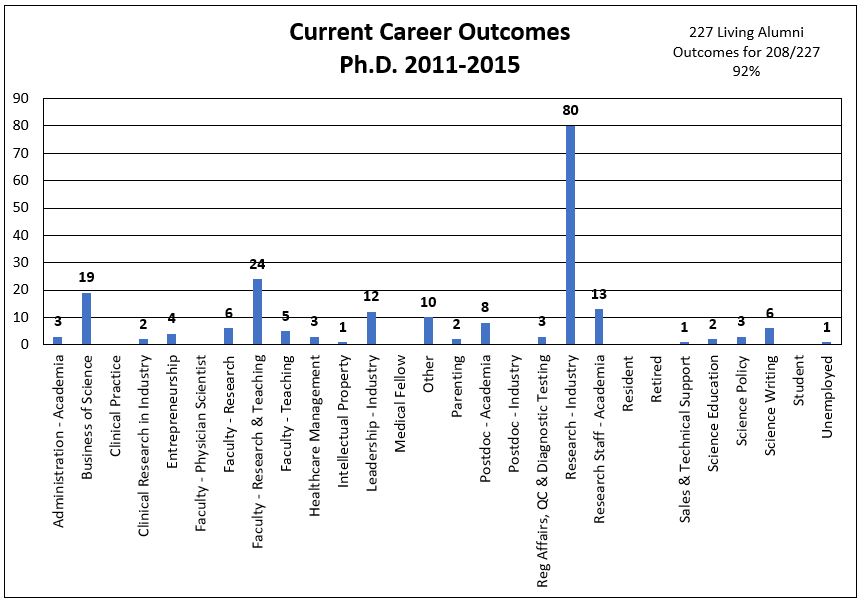
2011-2015
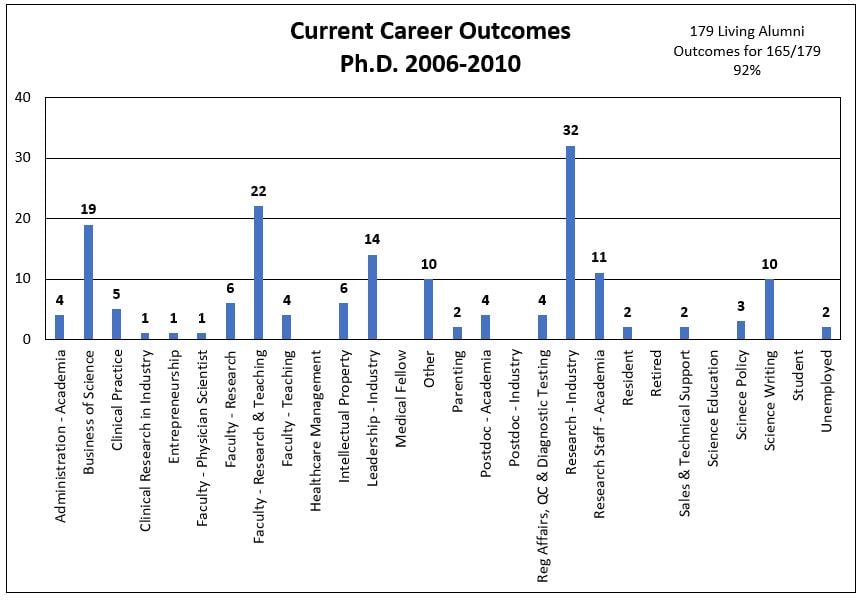
2006-2010
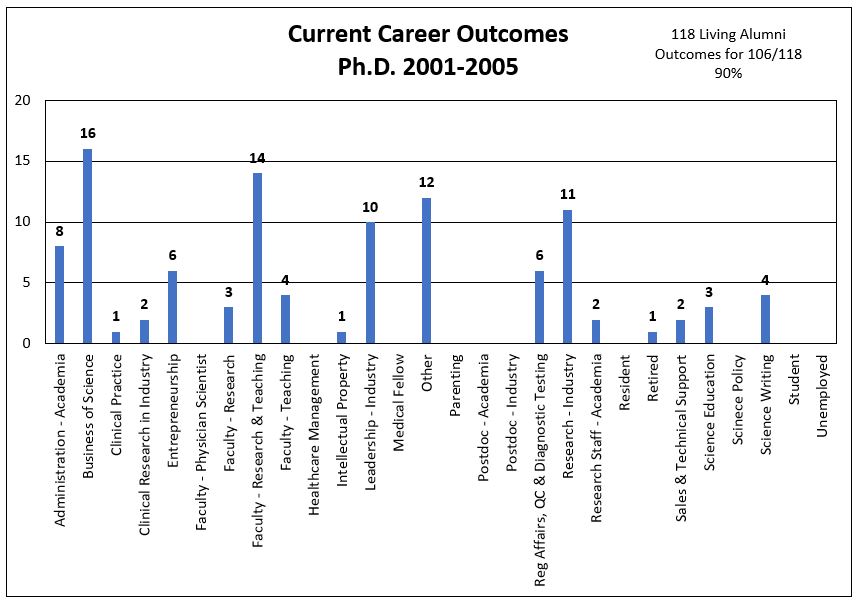
2001-2005
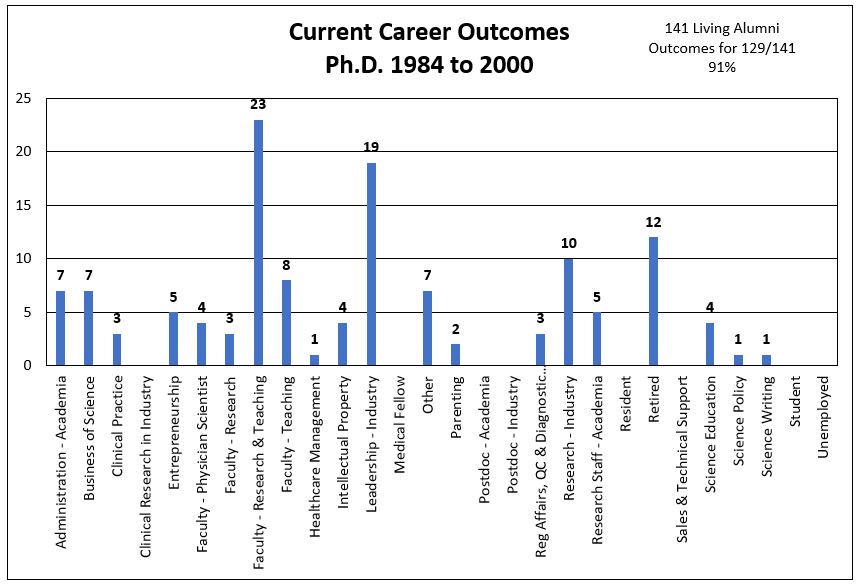
1984-2000