Data Visualization | SAP Lumira
What is SAP Lumira?
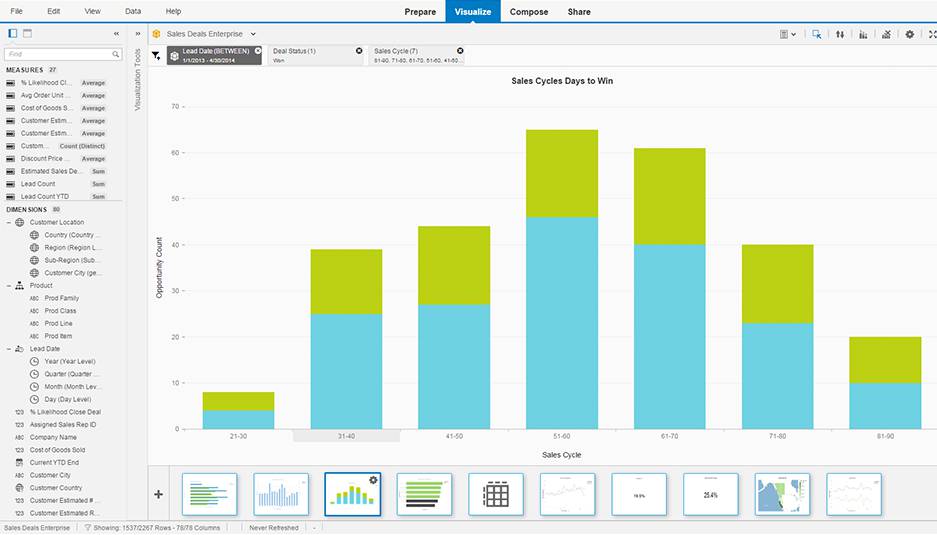
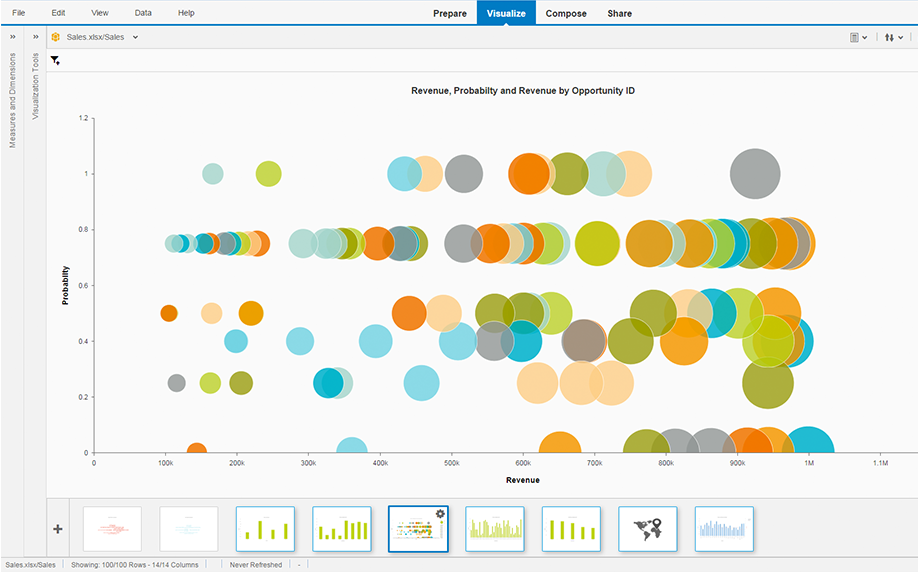
SAP Lumira (formerly called SAP Visual Intelligence) is a self-service, data visualization application for business users. It allows users to import data from Excel, CSV and variety of other sources, create beautiful and interactive charts, maps and infographics and perform visual Business Intelligence Analysis using intuitive dashboards. The tool also allows users to share their visualizations and data stories securely with other people within the organization.
Our Services
Once you have realized that it is time to improve your decision-making process by embracing all the data that you have and the insights that come with it, now you have to start visualizing and analyzing that data. Here at UMass Chan IT we can help you install and get the software up-and-running, create customized reports and dashboards, share them with your team-members and train you how to use the tool.

Sample SAP Lumira Data Visualizations


SAP Lumira Resources
Below you can find some useful resources to get you familiarized with the SAP Lumira software:
- Official Product Tutorials - SAP Lumira Website
- SAP Lumira 1.28 - 1.29 Video Tutorials - YouTube
- SAP Lumira, Personal Edition (Free) - SAP Store
- Past & upcoming SAP Lumira Webinars - Lumira Expert Series
- Product demonstrations - SAP Lumira Visualizations
- SAP Lumira Community Network - Forum
